
Asena Console
asena console runs your app in development and opens a browser page that shows how the app is wired and what it does while it runs. You can read the dependency graph, watch memory and output, call any route or socket, follow a request through its chain, run a schedule, and ask which @Catch answers a given error.
Starting it
Run it from the project root:
asena consoleThe command prints the page's address and opens it in your default browser:
Asena console: http://127.0.0.1:41873/?t=<token>| Option | Description | Default |
|---|---|---|
--port <port> | The console's own port; 0 picks a free one | A free port |
--no-open | Do not open the browser; open the printed address yourself | Opens it |
--no-watch | Do not restart the app when a source file changes | Restarts |
--port sets the console's port. The app listens on the port it configures, as it always does. Press Ctrl+C to stop both.
How the app runs
The console reads sourceFolder and rootFile from asena-config.ts and scans the source folder as asena build does. It then writes a temporary wrapper entry in the OS temp directory, which it deletes when it stops, and runs that as a child process, unbundled, from the project root. Your entry file is not rewritten. The child gets the terminal's environment and your project's tsconfig.json, and its output is copied to the terminal as well as to the page.
Saving a file under sourceFolder restarts the app, and the scan runs again, so a new component file is picked up. Editor temp files and anything under a dot directory are ignored, and several saves in a burst make one restart. To restart by hand, press Restart at the top of the page; it works with --no-watch too.
A restart or stop sends the app SIGTERM and then SIGKILL after 3 seconds. An app that crashes leaves the console running: its output stays on the page, and saving a file or pressing Restart runs it again.
If the browser loses the console, for example when the machine sleeps, the page reconnects on its own and fills in what it missed. The console keeps the last 2000 log entries and 500 requests for this.
What a project needs
@asenajs/asena-cli0.13.0 or newer, which provides the command and the page.@asenajs/asena0.13.0 or newer in the project, which provides the in-app agent at@asenajs/asena/devtools.- For HTTP requests in the Requests panel, an adapter that reports them. Ergenecore and the Hono adapter do, in the releases listed in the roadmap. An adapter that does not still runs under the console, and the panel then lists only event, schedule and message dispatches.
There is nothing to install, import or configure in the project. The wrapper entry loads the agent, and only a process the console spawned runs it. asena build, asena dev start and your own bun commands do not load it, and with no agent attached the framework and the adapters record nothing. The console also works on a headless app, which has no HTTP port: Endpoints then lists nothing to call, and the other panels work as usual.
An app with more than one server
The agent attaches to each AsenaServer the process starts, and every one of them is in the same console. With one server, the usual case, the page shows no sign of this. With two or more:
- A Server picker appears in the sidebar, above the box that names the adapter. It names each server by adapter and port, such as
Ergenecore :3000, and a headless one by the id the framework gave it, such asHeadless server-2. The page opens on the server that attached last. - The picked server is the one on screen. Components, Endpoints, Messaging, Config and Exceptions describe it, and the state in the top bar and the Health card are its own. Memory, CPU, event-loop lag and Output belong to the process, so they are the same whichever server is picked.
- Actions go to the picked server. A request sent from Endpoints goes to its port, and Run now, Emit and Send run on it. Each result says which server answered.
- Requests lists every server's records, each once, under the server whose handler, job or adapter produced it. A Server filter narrows the list to one, and the details of a record name its server.
A server that stops while the process runs on stays in the picker, marked (stopped). The page keeps what it reported, the top bar reads Server stopped, and its actions are off. The other servers keep reporting and answering.
An app whose agent has not reported
The agent attaches when AsenaServer.start() finishes. Until then the only live part of the page is the app's output. On the first run the other panels wait for the app to report. After a restart they keep what the previous run reported, under a note that says so, and Endpoints and Messaging say The app has not reported yet in place of their actions. When 10 seconds pass without a report, the console says so in the terminal and in Output, and the top bar reads No report yet:
[asena console] The app's devtools agent has not reported yet (10 s). It attaches when AsenaServer.start() finishes, and never under NODE_ENV=production. Until it reports, the console shows only the app's output.The console cannot tell an app that is slow to start from one that will never report, so the message names both. A slow app fills the page as soon as its start() finishes.
An app that runs as production
NODE_ENV=production inside the app keeps the agent out even when asena console started the process, for example when the entry file sets the variable itself. The app starts and serves as usual, records nothing, and logs one warning:
[AsenaServer] devtools agent not attached: NODE_ENV is production; the console is a development toolThe warning shows in the terminal and in Output. The other panels have nothing to show, because nothing reports to them, and after 10 seconds the console adds its own message.
The page
The sidebar holds the seven panels. The bar at the top shows the app's state (Starting, No report yet, Ready, Not ready, Degraded, Server stopped, Restarting, Stopped, Crashed, or Disconnected when the page has lost the console), the current run and process id, the uptime, the Restart button and the theme switch. The box at the bottom of the sidebar names the adapter, the port and the core version the app reports; in an app with more than one server the picker above it chooses the server.
Components
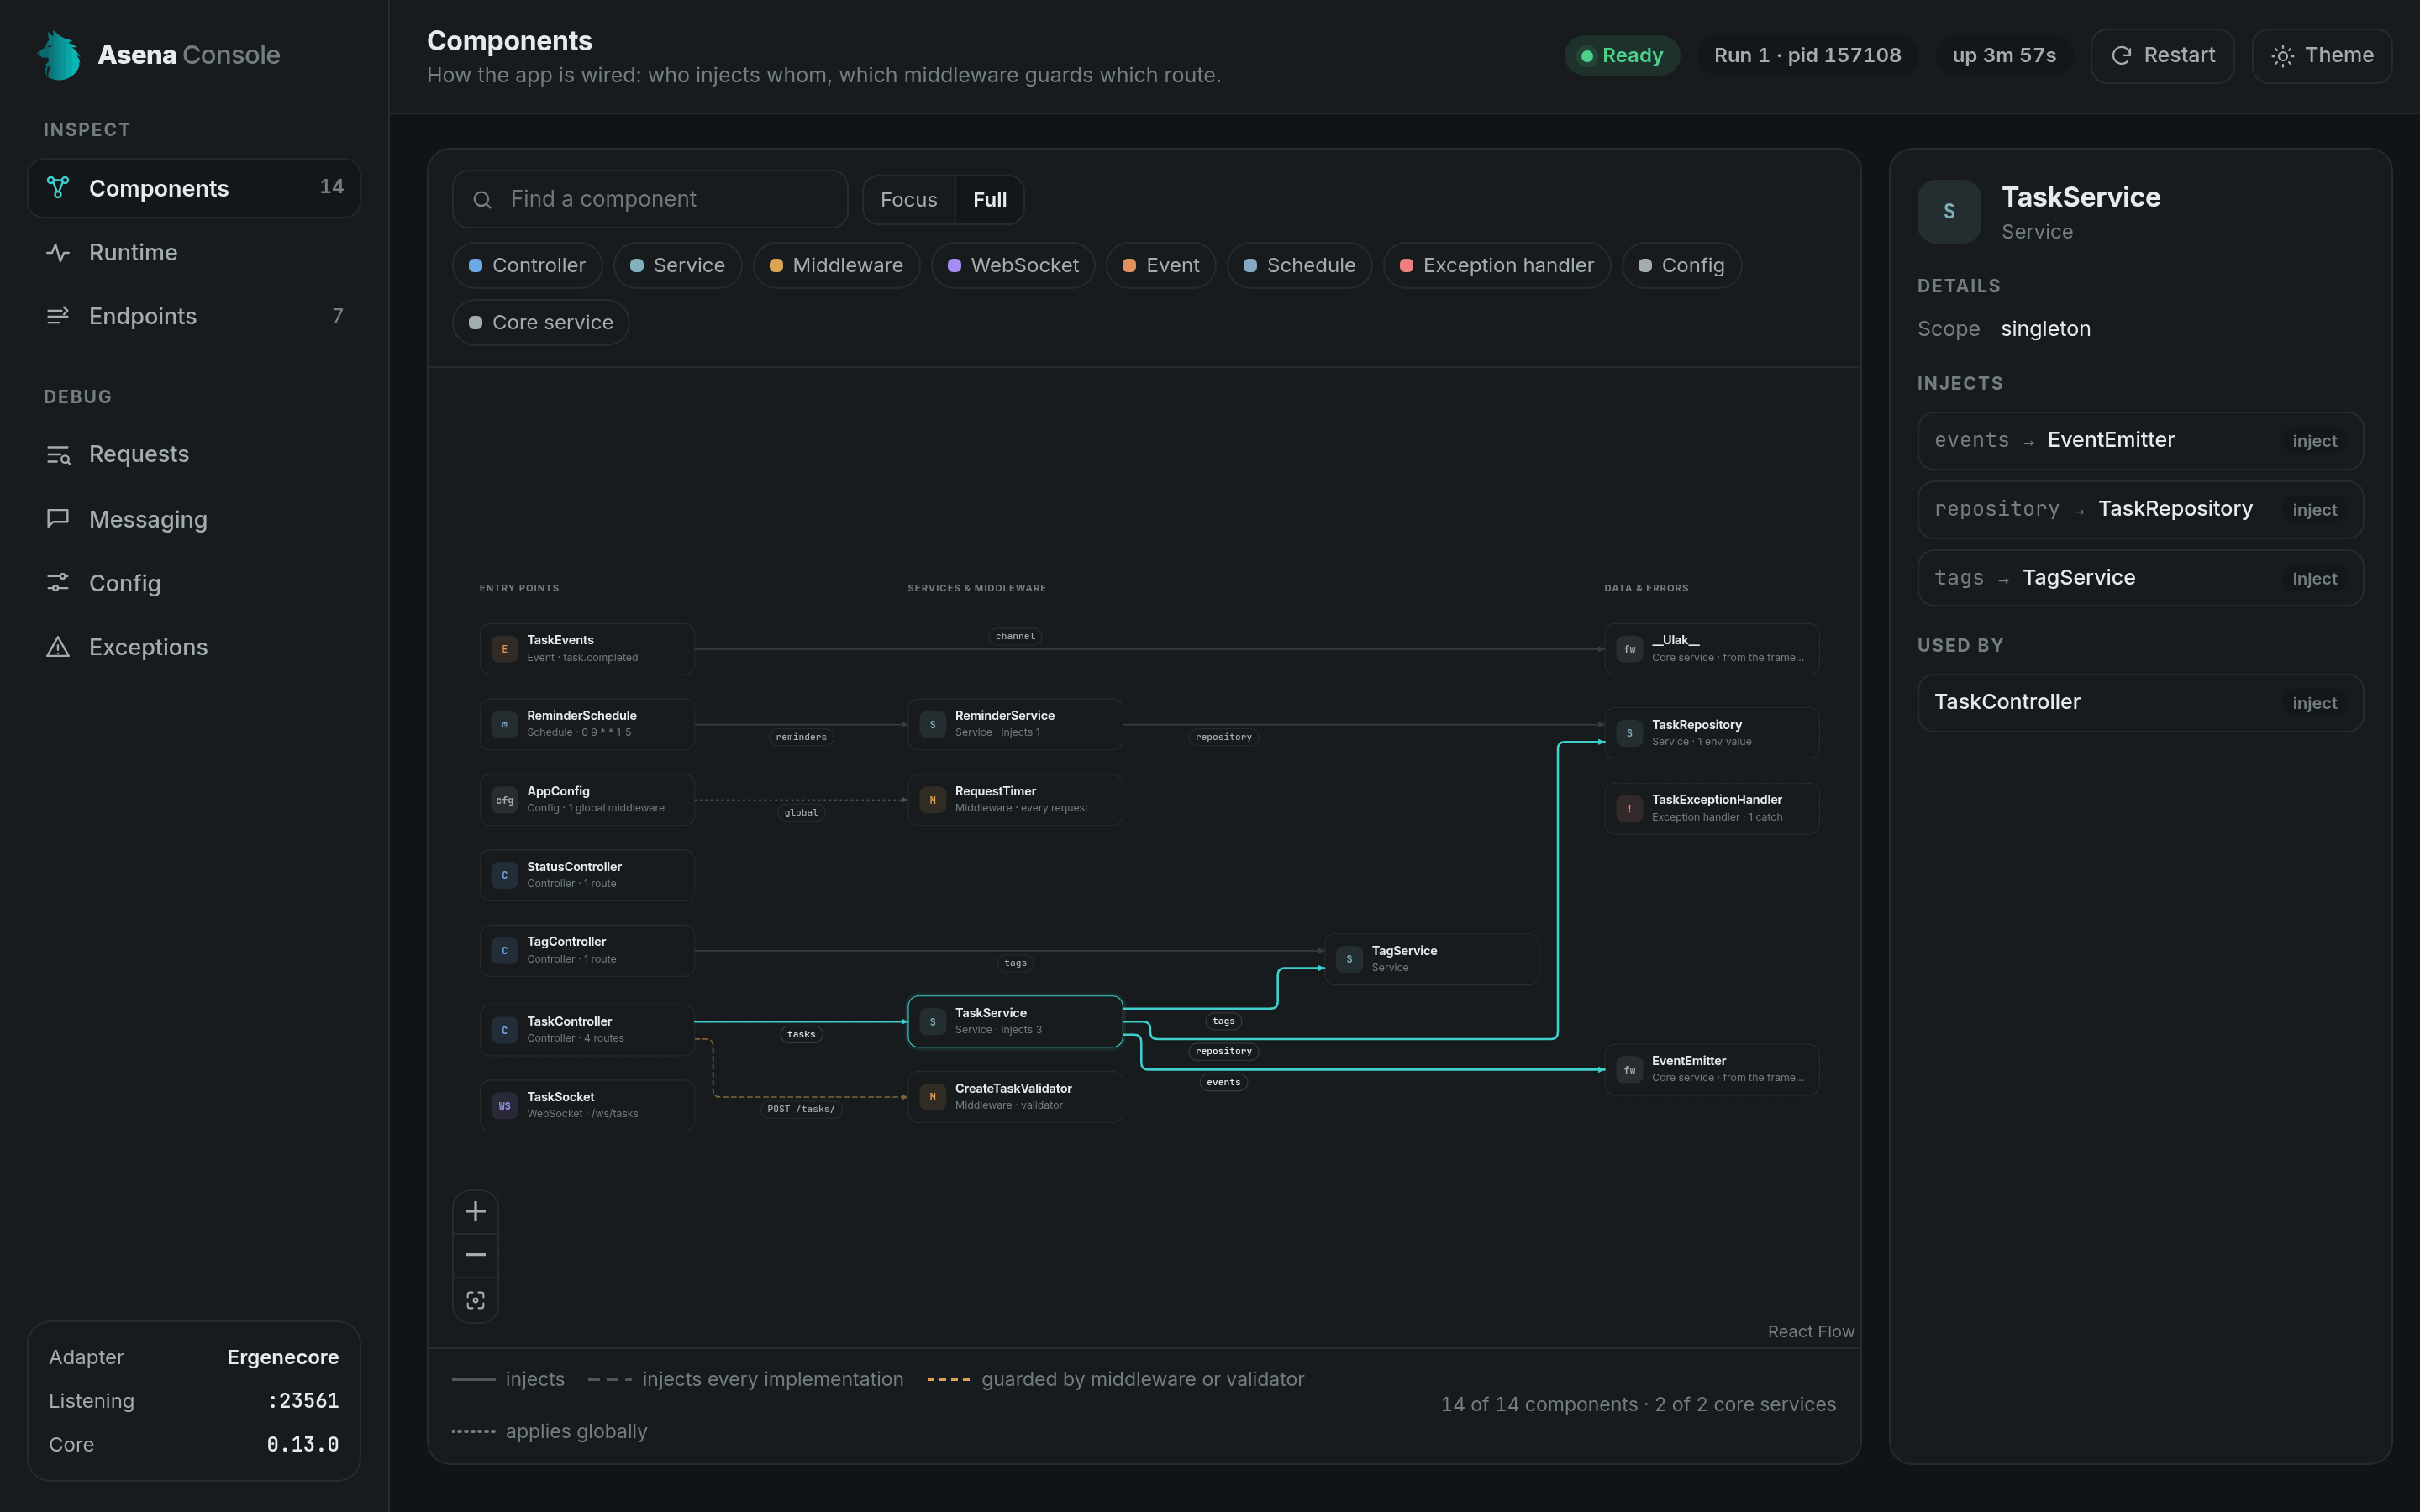
The graph of your components: who injects whom and which middleware guards which route. Components sit in three lanes: entry points on the left, services and middleware in the middle, data and error handling on the right.
| Line | Meaning |
|---|---|
| Solid | Injects |
| Dashed | Injects every implementation of an interface (@Strategy) |
| Orange, dashed | Guarded by a middleware or validator |
| Dotted | Applies globally |
The chips switch component kinds on and off, and the search box finds a component by name. The footer counts what is shown: components and core services are counted apart, so the component total matches the number in the sidebar.
Selecting a component opens the inspector beside the graph. It lists the fields it injects and who uses it, each with a link that selects that component, plus whichever of these apply: its scope, the routes it serves or guards, the environment variables its @Value fields read, the events and messages it handles, and the errors it catches. Try these in Endpoints opens its routes in the tester.
Focus and Full views
The Focus and Full buttons switch between two views of the graph.
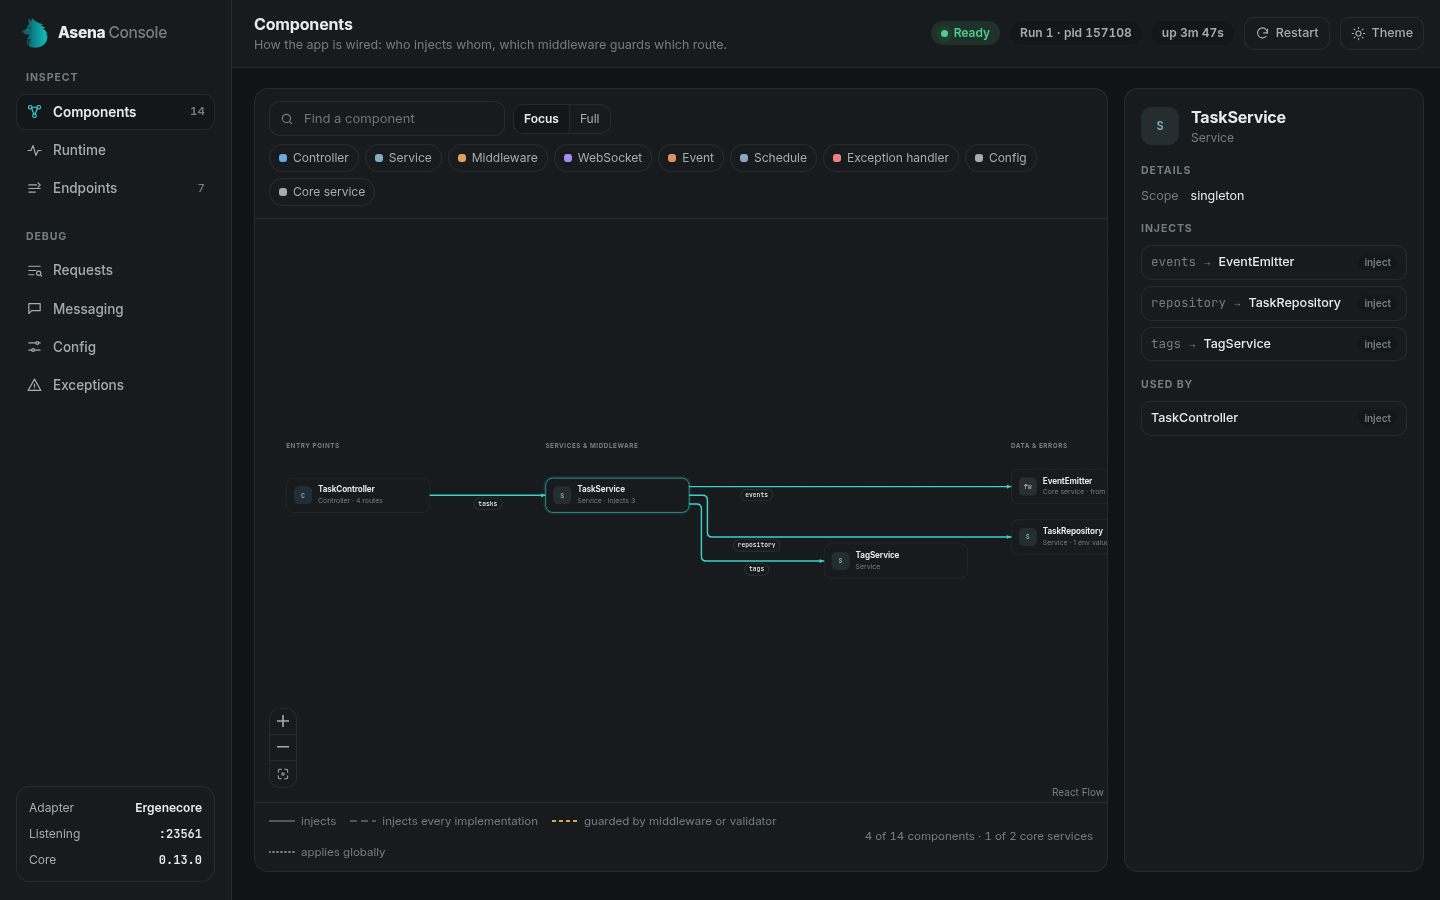
Focus shows the selected component and its direct neighbours in both directions, wired only to it.
- Clicking a neighbour moves the focus there. The chips filter the neighbours and never hide the focused component.
- More than 3 validators collapse into one
N validatorsnode, and more than 3 core services intoN core services. Clicking the node expands it in place. The inspector always lists them one by one. - The search box finds any component, not only those on screen, and lists the matches. Choosing one moves the focus;
Enterchooses the first andEscapeclears the search. - The first fit never goes below 60%. A larger neighbourhood starts at the top, for you to pan.
- On opening, the focus is the first controller that has a neighbour, or else the first component that has one.
Full shows every component and every edge. The search box dims what does not match, and how the view starts depends on the size of the app:
| 40 components or fewer | More than 40 components | |
|---|---|---|
| The panel opens in | Full | Focus |
| Full starts with | Every kind on | Core services and validators off |
| First fit | All of it in the card | To the card's width, no lower than 35%, from the top |
| Validators | Under the Middleware chip | A Validator chip of their own |
| Edges | Always drawn | Faint until you hover or select a node, which shows its own edges at full strength |
Clicking the empty canvas in a large app's Full view clears the selection. In any large-app view, zooming below 55% reduces each node to its name, enlarged. A name that does not fit shows in full in a tooltip, and on the node itself from a zoom level where it fits. The zoom buttons and the mouse wheel go from 15% to 160%, and the fit button returns to the first fit.
The view you pick holds until the page reloads or the app crosses the 40-component limit.
Runtime
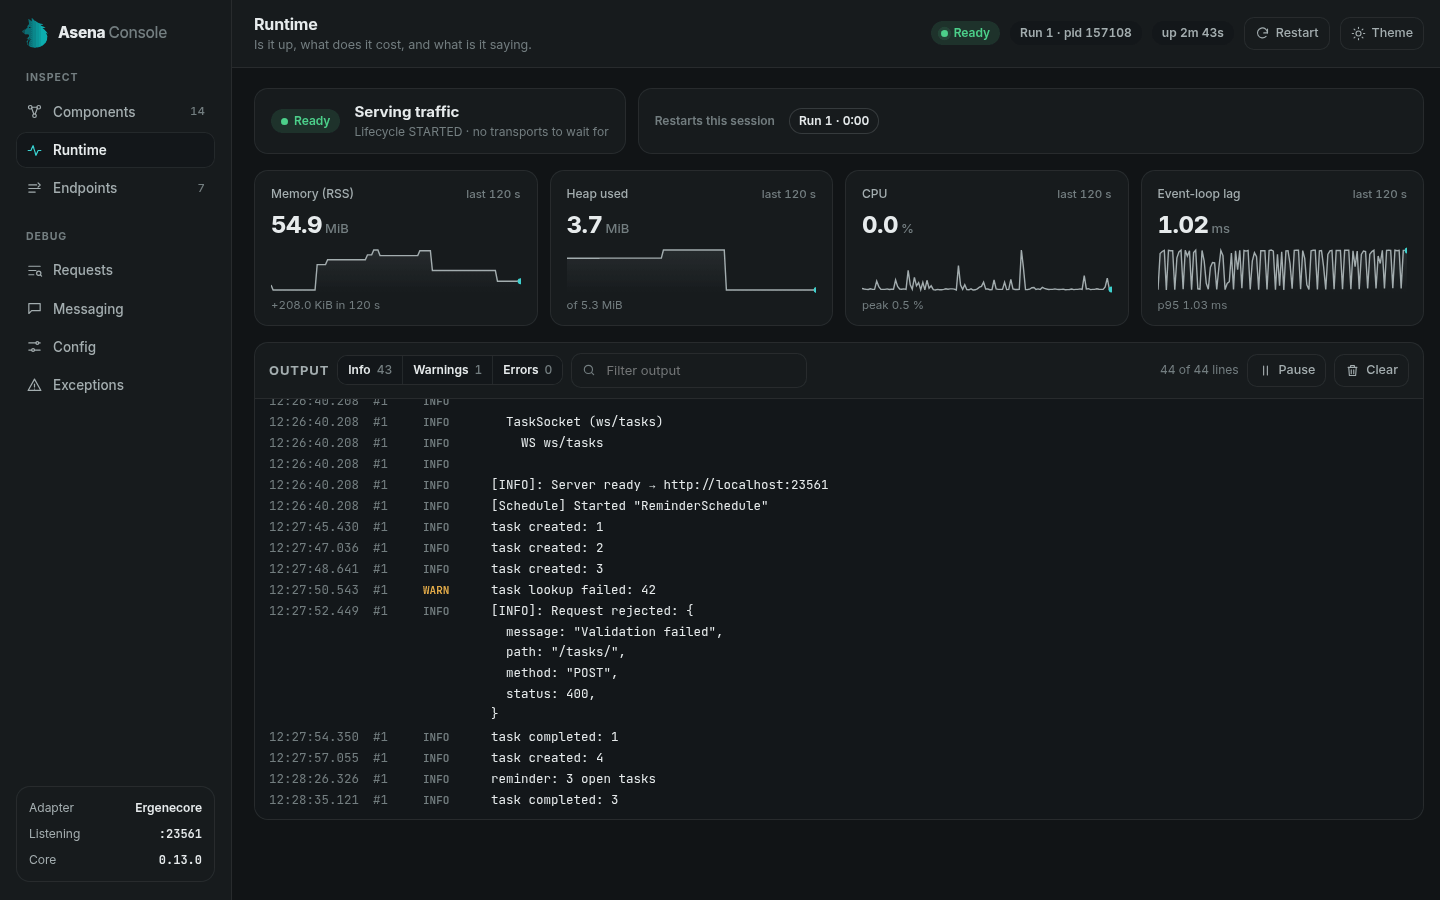
Whether the app is up, what it costs, and what it is saying.
- Health shows the state, the lifecycle phase and each microservice transport.
- Restarts this session is a timeline of the runs. Each says what started it: the first start, the Restart button, or the file you saved.
- Metrics sample RSS, heap, CPU and event-loop lag once a second. The console keeps the last 120 samples and starts over with each run. When the console is not reading, the agent does not queue telemetry in the app's memory: past 1000 unread messages it drops request records and metrics samples, and each later sample carries the number dropped so far in that run.
- Output is the app's stdout and stderr, with a separator between runs and a filter for level and text.
The level comes from a marker at the start of an entry's first line, such as [WARN], error: or TypeError:. Without one, a marker in the body decides, and after that an entry from stderr counts as a warning and one from stdout as info. An error's message and stack join one entry, so the Errors count follows real errors rather than lines. A logger's own timestamp and level are hidden when they agree with the console's columns; hover over a row for the raw line.
Pause holds the view and counts what arrives meanwhile. Clear empties the view only, and reloading the page brings the lines back.
Endpoints
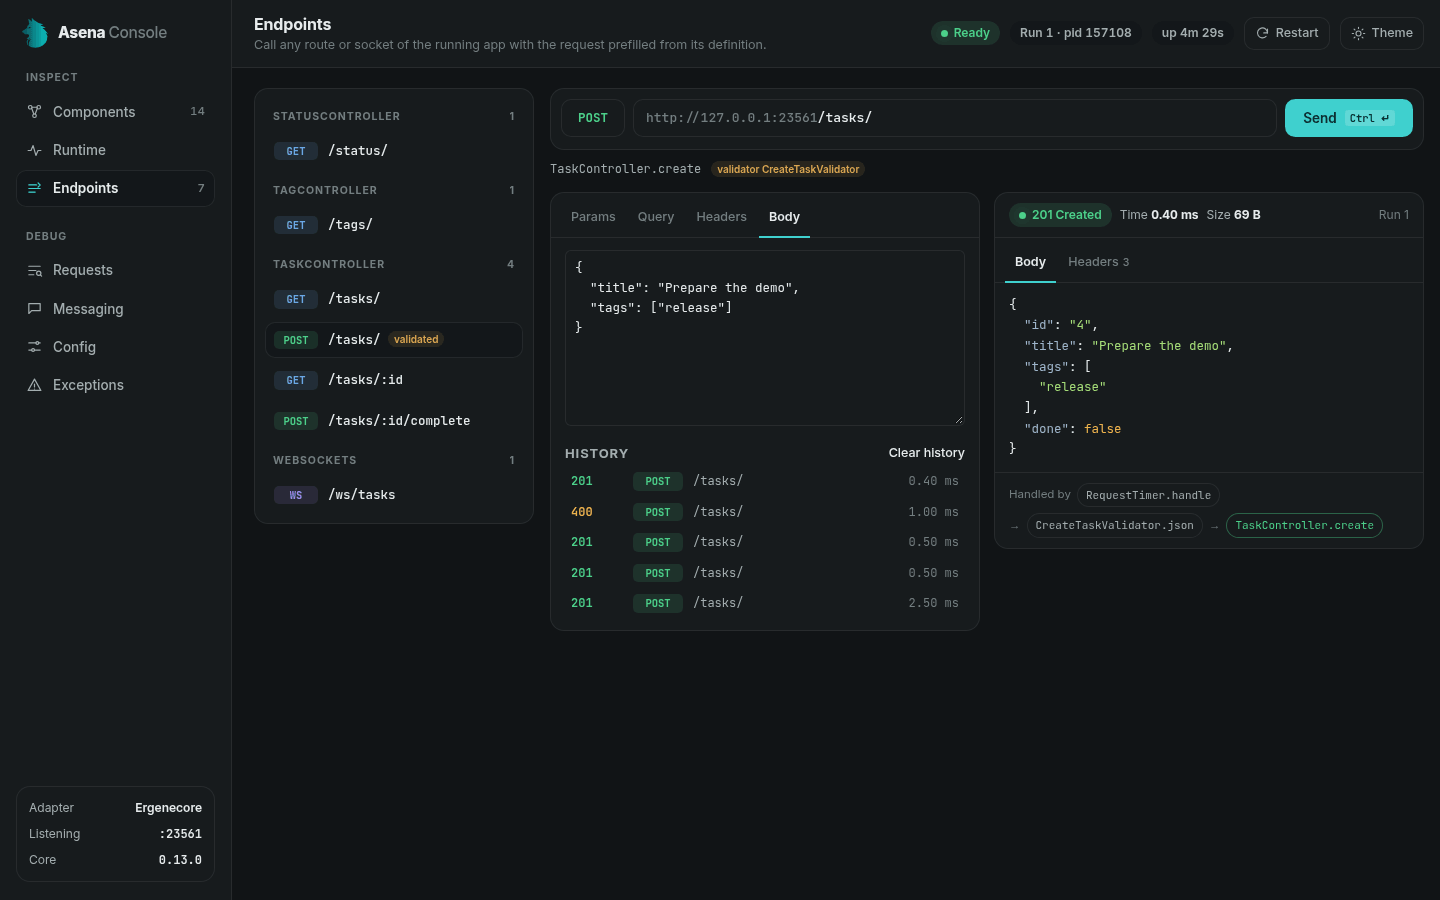
Every route of the app, grouped by controller, and every WebSocket namespace.
Choosing a route gives you a request prefilled from its definition: the method, a field for each path parameter, and {} as the body when the route declares a body schema. Add query parameters and headers, then press Send or Ctrl+Enter. A body sent without a Content-Type goes as application/json. The console sends the request from its own process to 127.0.0.1, so CORS does not apply; redirects are shown rather than followed, and it gives up after 30 seconds.
The response shows its status, time, size, body and headers, and which run answered. Handled by shows the chain that produced it, from the same record the Requests panel uses.
Each route keeps its last 20 requests under History, in your browser. Clicking one restores the request and its response.
Choosing a namespace opens the WebSocket tester: connect, send text or JSON, and read the frame log. The browser connects straight to the app, so the handshake carries the console's origin. A namespace guarded by WebSocketOriginMiddleware must allow that origin; --port keeps it the same between starts.
Requests
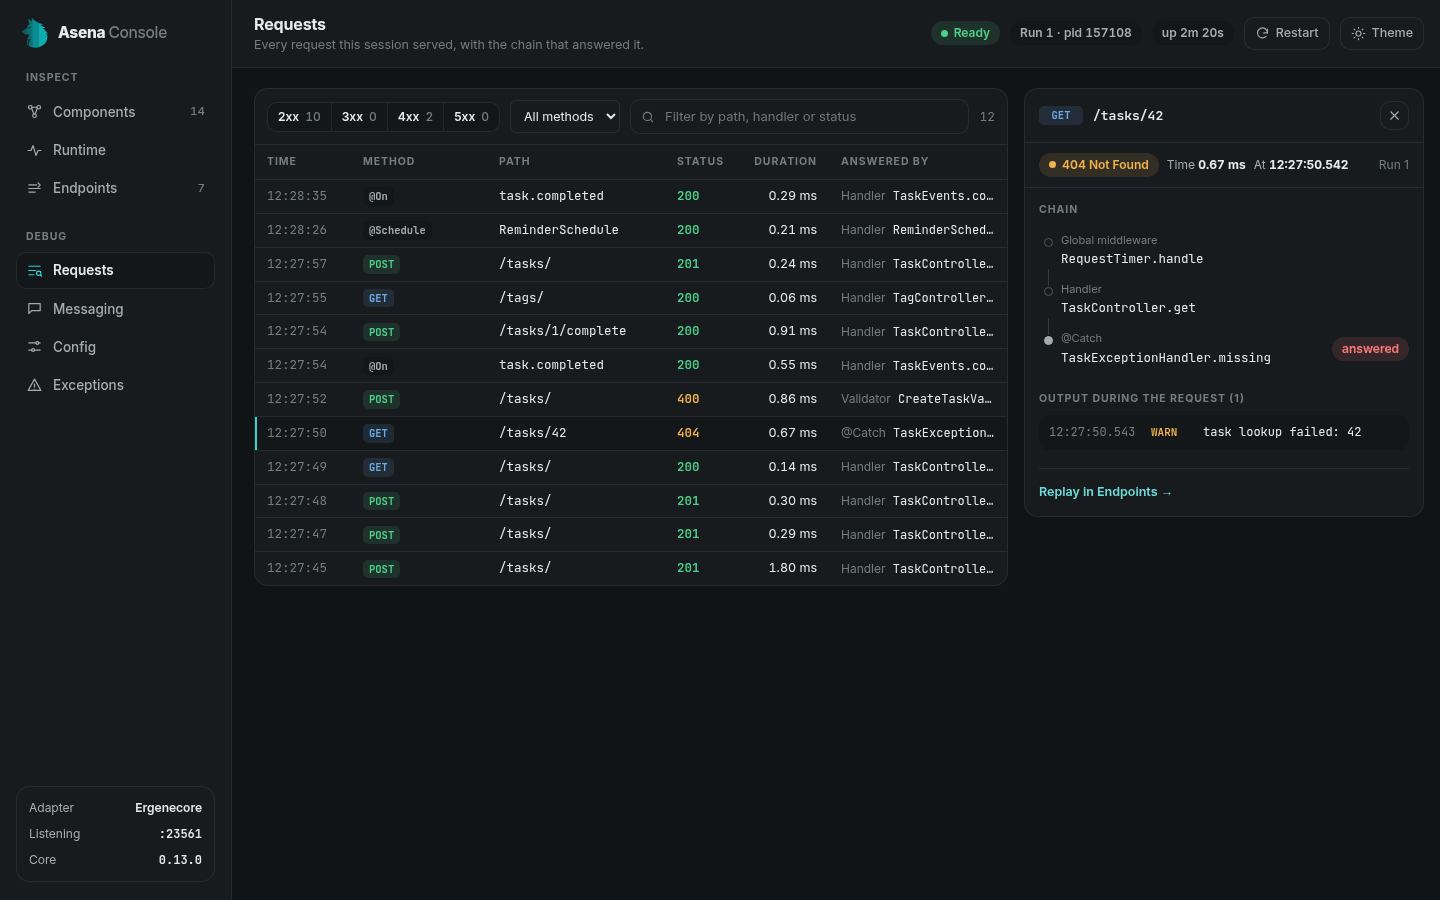
Every request the app served this session, newest first, with what answered it. Filter by status class, method or text.
The list also holds what the app dispatched outside HTTP. @On, @Schedule, @MessagePattern and @EventPattern appear in the method column, with the event, job or pattern as the path.
Selecting a row opens its details:
- Chain lists the steps it went through (global middleware, middleware, validator, handler,
@Catch,@Config.onError, the adapter's default, not found) and marks the one that answered. - Output during the request is what the app wrote through
console.*,process.stdoutandprocess.stderrwhile this request was in scope, up to 100 entries or 16 KiB. Concurrent requests do not mix. See How output is captured. - Replay in Endpoints opens the route with this request's method and path values. Headers and bodies are not recorded, so fill those in again. A dispatch is run again from Messaging instead. In an app with more than one server, a request another server served is replayed after picking that server in the sidebar.
How output is captured
In a process the console started, the agent wraps console.log, info, debug, trace, dir, table, warn, error and assert, and process.stdout.write / process.stderr.write, once, when it loads, which is before any module of your app does. The wrappers stay for the life of the process. Outside a request or dispatch they only pass the call on, and every write still reaches its stream.
- Inside a request, a console call whose arguments are plain data (primitives, and plain objects and arrays of them) reaches the original method unchanged. Any other call (a class instance, a getter, a
%s-style format string) is rendered once for the record and the original method prints that text, so inspecting the arguments runs once. console.count, theconsole.timefamily and the label and indent ofconsole.groupare not part of the record.- A console method that something replaced before the agent loaded, such as a preload script, is left as it is. The record then holds only what that replacement writes to
process.stdoutorprocess.stderr. - A console method your own code replaces is replaced after the agent loaded, so the record holds the line as the replacement prints it. A wrapper that redacts secrets before it calls the original keeps them out of the record too.
- A request's chain holds 100 steps at most. Past that each new step replaces the last one kept, so the final step shown is always the most recent one.
Messaging
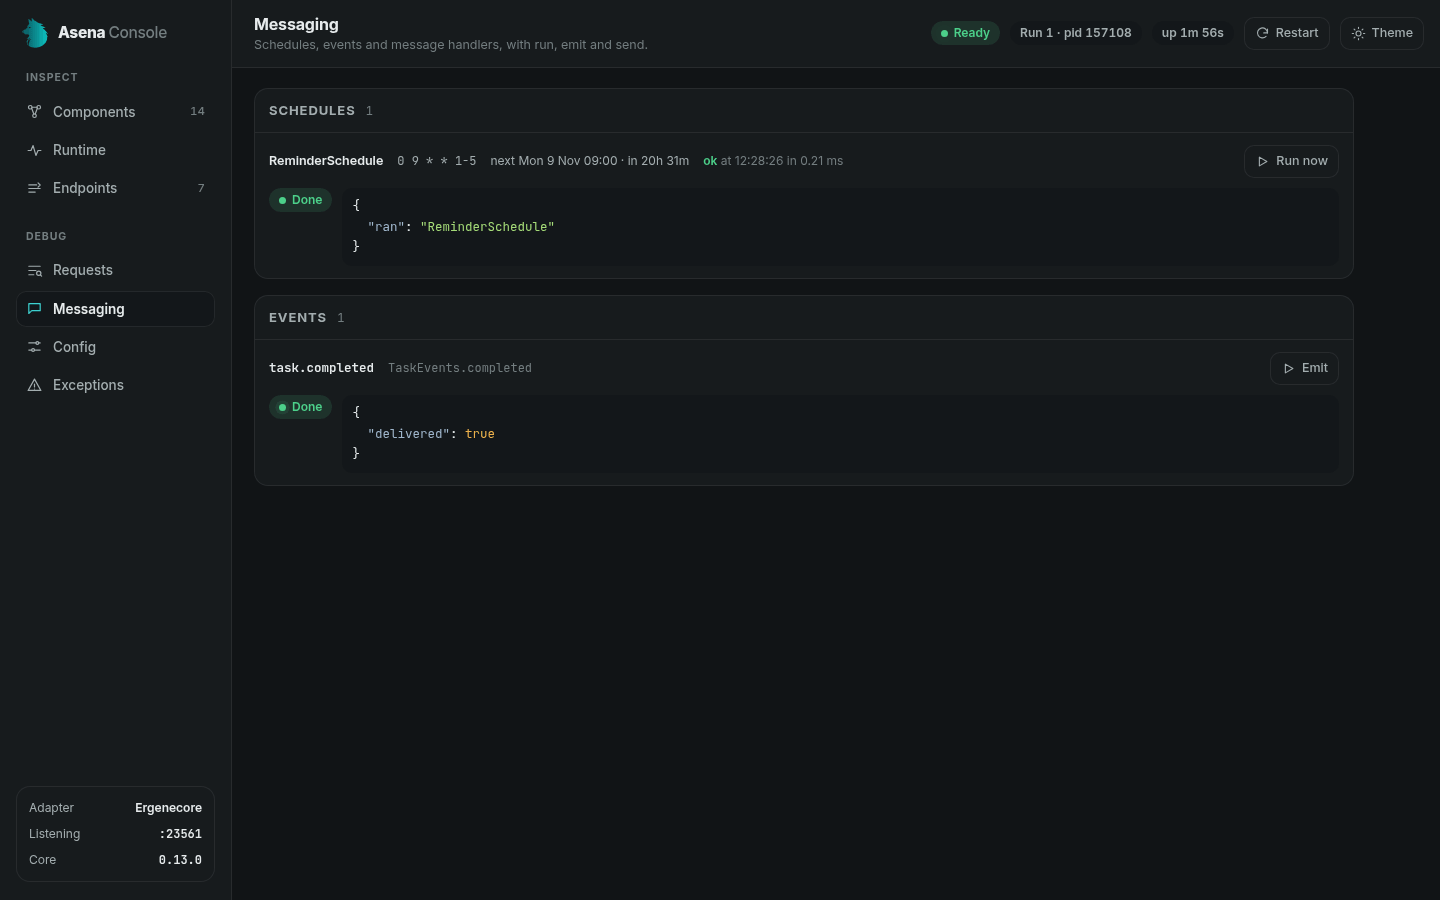
The app's schedules, events and message handlers, with an action for each. Every action runs inside the running app through the same path a real trigger takes.
| Section | Shows | Action |
|---|---|---|
| Schedules | The cron expression, the next run in the app's time zone, and the last run this session | Run now runs it once; the schedule stays as it is |
| Events | Each @On event with its handlers | Emit takes an optional JSON payload and an editable event name. Write a concrete name, not a pattern |
| Messages, one section per transport | Each @MessagePattern and @EventPattern with its handler, and whether the transport is connected | Send takes an optional JSON payload. A @MessagePattern waits for the reply; an @EventPattern publishes to every subscriber |
Each action asks for an inline confirmation that says what it will do, and then shows the result or the error. A command still waiting when the app restarts or exits ends as failed.
An action the app cannot run ends as failed with the reason:
| Reason | When |
|---|---|
The server is stopping; the command was not run | The action arrived after the app began to stop |
No attached server has the id "..."; the command was not run | The action arrived after its server stopped, in an app with more than one |
@Schedule job "..." not run: it is already running | Run now on a job whose previous run has not finished. A job never overlaps itself |
@Schedule job "..." not run: the scheduler is stopped | Run now after the app called stopAll() on its CronRunner |
Config
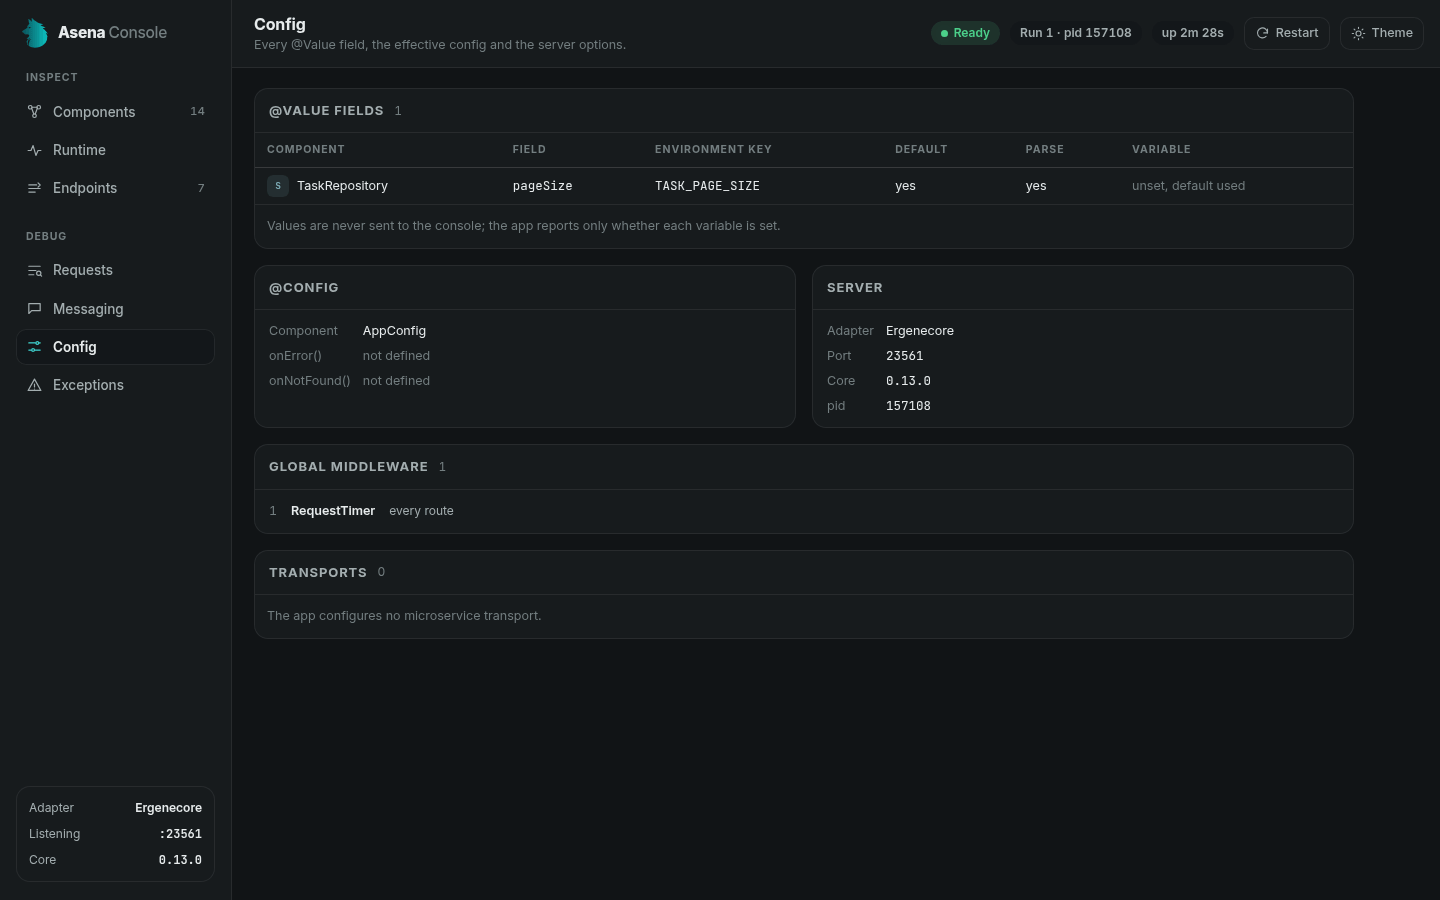
@Valuefields lists each field with its component, environment key, whether it has a default and a parser, and the variable's state:set,unset, default usedorunset, no default. A key that reads like a credential is taggedsecret-looking. The values themselves never reach the console.@Confignames the component and says whether the deprecatedonErrorandonNotFoundare defined.- Server shows the adapter, port, core version and process id.
- Global middleware lists them in run order, with the routes each one covers.
- Transports lists the microservice transports and whether each is connected.
Exceptions
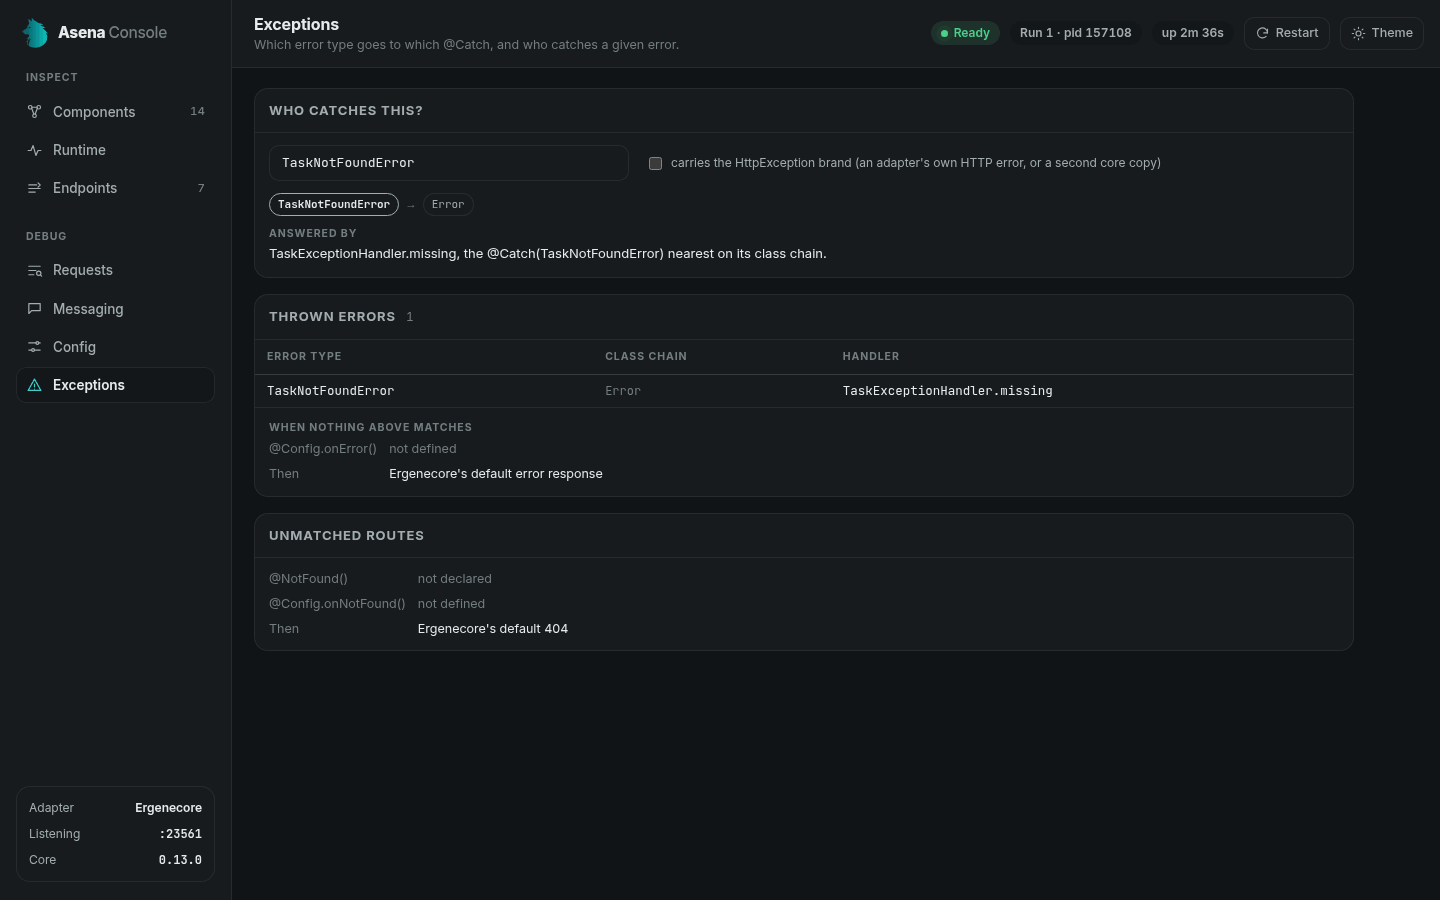
How errors resolve in this app, per the rules in Error Handling.
- Who catches this? takes an error class name and walks its chain the way the exception registry does: the nearest
@Catch, then@Catch(HttpException)for a branded error, then the catch-all. It names what answers and why. A checkbox asks the same question for an error that carries theHttpExceptionbrand. - Thrown errors maps each caught type to its class chain and handler, then says what answers when nothing matches.
- Unmatched routes shows the same for a request no route serves:
@NotFound(), then the deprecated@Config.onNotFound(), then the adapter's 404.
Security
The console is a development tool that can act on your app, so it is built to stay on your machine.
- It does not start in production. With
NODE_ENV=productionthe command prints a refusal and exits with code 1. That variable is the only check it makes, so see the warning below. The framework makes the same check inside the app: withNODE_ENV=productionit does not attach the agent or record anything. - It binds to
127.0.0.1. The console's server is not reachable from another machine. The app keeps its own binding, which the console does not change. - The URL carries a token. Each start creates a random token. Without it the page, the page's socket and the request tester answer
403; only the page's static files are served without it. Anyone with the full URL can act on your app, so treat it like a password. - Actions ask first. Run now, Emit and Send in Messaging do nothing until you confirm inline. The Endpoints and WebSocket testers send as soon as you press Send, as any HTTP client does.
- Environment values stay in the app. The agent reports whether each
@Valuevariable is set, never its value. It opens no port of its own and talks to the console over the IPC channel of the child process.
Two things can still put a secret in front of you or in your browser:
- The output panels show what your app prints. If it logs a secret, the secret appears on the page.
- Endpoints history is kept in your browser's local storage, with the headers and body of each request and its response, whose body is cut at 16 KiB. A pasted token stays there until you press Clear history. Local storage belongs to the page's origin, so a fixed
--portkeeps the history between starts and a free port starts empty.
Requests and actions are real
Everything the console runs reaches your real handlers and whatever they connect to. The app gets the terminal's environment, and Bun loads your .env as usual. An environment that points at a shared database with NODE_ENV unset is not refused, so check where the environment points before you press Send or Emit.
When it does not start
The command prints the reason and exits with code 1.
| Message | Cause |
|---|---|
asena console is a development tool and does not start when NODE_ENV=production. | NODE_ENV is production |
No config file detected or invalid format | No readable asena-config.ts in the current directory |
asena console needs @asenajs/asena 0.13.0 or newer, ... | The project's core is older, or not installed. The message names the version it found |
asena console could not start: Failed to start server. Is port 23531 in use? | The port given to --port is taken |
If the CLI and the app's core speak different versions of the console protocol, the console starts but says so in the terminal and in Output, and it drops the agent's messages. Updating @asenajs/asena-cli or @asenajs/asena so that they match fixes it.
Related
- CLI Commands - Every other command
- Error Handling -
@Catch,@NotFoundand how errors resolve - Event System -
@Onhandlers - Microservices -
@MessagePatternand@EventPattern